| 
County Residents Support CenterLine
Plans
Updated September 25, 2003
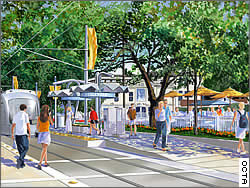 |
Artist rendition of the proposed CenterLine
light rail system in downtown Santa Ana.
|
Latest Findings, CSUF – OCBC Quarterly Survey:
County Residents Support CenterLine Plans:
• Would vote 55% “yes” on hypothetical ballot measure
• Do not themselves use public transportation
• Six out of ten rate current public transportation positively
• Disapprove of Legislature
Orange County Residents Say
‘Yes’ to CenterLine
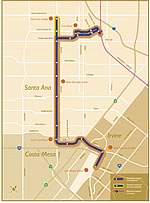
Some 55% of Orange County residents would – if the question
were put before them today – vote in favor of building a light
rail line from Santa Ana to John Wayne Airport, according to the
latest survey findings from Cal State Fullerton’s Center for
Public Policy in partnership with the Orange County Business Council.
Of the 506 Orange County residents reached
in a telephone survey conducted between Aug. 26 and Sept. 10, 2003,
45% said they would vote against such a proposal.
The survey employed the question wording
proposed by Supervisor Chris Norby, as follows:
Now I will read
you a possible ballot question, which is this: “Shall the
County of Orange support the building of a $1 billion light rail
line from Santa Ana to John Wayne Airport, with possible future
exten-sions?” If you were to vote today on that ballot question,
would you vote yes to approve building light rail, or no to oppose
building light rail?
Norby, a CenterLine skeptic / opponent,
proposed his ballot measure language in the context of a debate
in which he took the view that Orange County voters, if asked, would
defeat a CenterLine plan.
“This survey
cannot with certainty predict a hypothetical election, of course,”
noted Keith Boyum, director of the CSUF Center for Public Policy.
“Variables including turnout, the budgets available to groups
favoring and groups opposing CenterLine, the lineup of other candidates
and issues on the ballot, and many other standard political factors
would surely enter in, and cannot be accounted for here.
“However,”
continued Boyum, “in this survey, we tried to be especially
thorough. We sought to probe respondent attitudes in a variety of
ways, and to provide pro / con information for them to consider
– mimicking, thus, at least a part of the information exchange
that a campaign about CenterLine might evoke.”
In this survey, Democrats were somewhat
more likely to say that they would vote “yes” than Republicans.
Democrats broke 61% - 39% in favor of the hypothetical ballot measure.
Republicans were evenly divided, at 50% - 50%.
Orange County residents do not
ride buses, commuter trains. Beginning the series of questions
that preceded the question about a hypothetical ballot measure,
the survey inquired first:
How often would
you say that you take either a bus or a commuter train for travel
in Orange County?
Some 83% responded “almost never,” with
another 8% responding “Rarely.”
“With about nine out of ten in the survey
reporting public transportation ridership varying from rarely to
almost never, an analysis of these data as between those who ride
buses and commuter trains and those who do not will not make sense,”
noted Boyum. “These data should thus be taken as a fair Orange
County sample – we surveyed mostly folks who commute via car.
But here we asked them a series of questions about public transportation.
Six out of ten give generally favorable ratings
to Orange County public transportation. The survey continued
with a rating question, as follows:
Still thinking about buses and commuter
trains, would you rate public transportation in Orange County as
very poor, poor, good, or very good?
As Table One indicates, Orange County public transportation
won more positive than negative judgments – as rated by this
sample of non-users of public transportation.
|
Table One
Ratings of Public Transportation in
Orange County |
| |
|
Very Poor |
14 % |
|
Poor |
29 % |
|
Good |
46 % |
|
Very Good |
11 % |
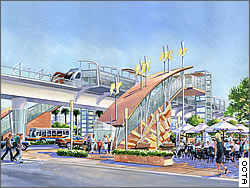 |
| Artist rendition of a CenterLine elevated
platform. |
County residents unfamiliar with CenterLine
proposals. Turning specifically to the CenterLine idea,
39% of Orange County residents reported that they were either “somewhat”
familiar [29%] or “very” familiar [10%].
“These data say clearly that most people
don’t know much about a CenterLine proposal, all in all,”
noted Boyum. “That’s not a surprising finding, since
we understand the low level of information about local issues held
by ordinary people – and particularly, ordinary people in
a county whose media are largely based in a different county, in
Los Angeles. Indeed, in anticipation of just such a finding of low
familiarity, the survey asked a substantial series of further questions
and probes into respondent attitudes.
”Pros and cons of light rail; alternatives
to light rail; light rail as part of a desired public transportation
mix. Respondents were next asked a series of questions
that included two focused on alternatives to light rail [taking
the form, “Rather than build light rail, we should …”]
and two mildly supportive, together with a question about personal
interest in riding light rail. The order of the questions was rotated,
meaning that each question had an equal chance of being asked first
in order, second in order, etc.
Responses are shown in Table Two.
| Table
Two
Agree/Disagree With Building
Light Rail and Alternatives to Light Rail* |
| |
Strongly
Agree |
Agree |
Disagree |
Strongly
Disagree |
| Light rail should be part of the mix of transportation
in Orange County. |
43% |
38% |
9% |
11% |
| We should build light rail even for a short distance,
as a starter for the future. |
33% |
40% |
11% |
16% |
| Rather than build light rail, we should widen
the 22 freeway, or extend the 57 freeway to the 405. |
31% |
22% |
22% |
25% |
| Rather than build light rail, we should improve
the bus system. |
21% |
29% |
30% |
21% |
|
| I would like to use light rail myself. |
27% |
35% |
13% |
26% |
*Rounding errors may make some totals
equal other-than 100%
“Perhaps
the most interesting observation about these numbers is the agreement
with the concept of light rail, at what we might call a philosophical
level,” noted Boyum. “Light rail should be part of the
mix, respondents agree. Let’s start for the future, they agree,
even if that means accepting a short line. And six out of ten say
they’d like to be trolley-riders, themselves. All in all,
respondents seem to have something of an ideal mix of local public
transportation in mind.”
“Remember, these are not riders of public
transportation,” commented Phillip Gianos, CSUF professor
of political science. “Yet clearly they like the idea of light
rail; and only a tepid majority arises in these data for what might
be considered attractive alternatives for a car-driving population:
improving or extending freeways.”
Julie Puentes, executive vice president, Orange County
Business Council, commented: “Respondents are saying clearly
that transportation and congestion remain top issues for Orange
County and that a comprehensive mix of solutions, including both
rail and highway improvements, is needed. Support for rail is extraordinarily
strong, especially considering that respondents say they won't use
it.”
“Ms. Puentes is right,” commented
Gianos. “It raises an intriguing further question –
about which we can speculate. It is whether our respondents are
pursuing an idea about the overall good for the general public.
Call this a "public-regarding" attitude or point of view.
Or to the contrary: are our respondents looking out for themselves--
thinking that if someone else uses public transportation and I don't,
congestion will be relieved for me as a by-product?”
“I think we also have to take NIMBY –
‘not in my back yard’ – into account,” said
Boyum. “People in Irvine voted no on CenterLine – not
as a concept, but as a proposed set of rails in neighborhoods. What
people like in concept is frequently not what they want in their
back yards.”
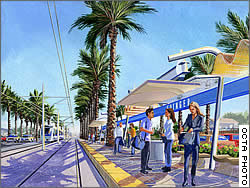 |
| Artist rendition of CenterLine light rail
system. |
Statements pro and con about CenterLine.
Pressing on, the survey posed to respondents a series of statements
about light rail in Orange County. This served two purposes. First,
it allowed further probes into the apparent interest in building
light rail in a county and region known for freeways. Second, taken
as a package, the statements could be taken as foreshadowing –
if imperfectly – some of the information pro and con that
would emerge in a campaign if a measure about CenterLine were to
be placed on the ballot.
We asked respondents the following question.
Now I want to read you some statements about the
proposed CenterLine light rail. Please tell me whether each statement
makes you much less, a little less, a little more, or much more
likely to support the proposed construction.
The questions were rotated during the administration
of the survey, meaning that the order in which they were asked changed
from respondent to respondent, with each question having equal turns
to be asked first, to be asked second, etc.
Results are shown in Table Three.
Table Three
More / Less Likely to
Support Light Rail, Given Each Statement* |
Each statement (below)
makes respondent . . . . . > |
Much more likely to support |
More likely to support |
Less
likely to support |
Much less likely to support |
| Light rail will require no new local taxes. |
50% |
30% |
8% |
13% |
| Later extensions of light rail, if built, would serve more
areas of the county. |
44% |
37% |
7% |
11% |
| About 84% of the cost for light rail would be paid by the
federal and the state governments. |
40% |
32% |
13% |
15% |
| The local share of the light rail cost would come from taxes
already being collected. |
37% |
32% |
1% |
17% |
| People in Irvine voted against CenterLine for their city. |
30% |
22% |
26% |
22% |
| Light rail may get very few people to stop driving their cars. |
23% |
24% |
27% |
26% |
| Initially, light rail would run only from Santa Ana to John
Wayne Airport. |
19% |
29% |
23% |
30% |
*Rounding errors may make some totals
equal other-than 100%
“People
obviously react well to the idea that no new local taxes would be
required to pay for CenterLine,” observed Gianos.
“Seven or eight out of ten among our
respondents reacted very positively to the generally supportive
statements about building a light rail line,” continued Gianos.
“Meanwhile, however, the fact that the line would be short,
and not get people out of cars, seemed to make only small majorities
of our respondents think a less-positive thought about trolleys.
The fact that Irvine voters spurned light rail got only about half
of our respondents to say that, yes, that statement made them think
less well of the rail proposal.”
Ray Young, professor of geography
at CSUF, is the author of Commuting in Orange County, a report
published by the Cal State Fullerton Center for Demographic
Research (December 2002). Contact: 657-278-3528
Young comments about this survey:
When presented with details about the light
rail proposals, Orange countians are supportive of such a
transportation option, even when their personal experiences
have been conditioned by an ‘automobility’ of
freeway dependency.
It is noteworthy that the public is more receptive
to a light rail future than to bus system expansion. That
may be linked to the prospect of greater speed as well as
the novelty of a rail starter line, linking major activity
nodes and job centers in the county.
Remember that the light rail concept was approved
as part of the Measure M funding initiative in 1990, a process
that led to substantial freeway widenings and bus line improvements.
Considerable dollars have already been expended on the planning
phases for light rail options as part of a diversified transportation
system to serve the county’s growing population and
projected job increases. |
_________________________
Previous results of CSUF/OCBC quarterly
surveys are conveniently accessible on the OCBC web site. See:
http://www.ocbc.org/resourcesf.htm
_________________________
These data result from a Random Digit Dialed survey
of 506 households in Orange County. The survey was administered
by telephone between Aug. 26 and Sept. 10, 2003, by the California
State University, Fullerton Social Science Research Center (SSRC)
for the university’s Center for Public Policy. The SSRC director
is Gregory Robinson.
The population of inference is heads of household
or their spouses or domestic partners, 18 years of age or older,
residing in households with telephones in Orange County. Interviews
typically ran about 11 minutes.
Computer-assisted telephone interviewing software was utilized,
supporting highly accurate call management. For example, up to 21
call-back attempts were made in some cases to obtain completed interviews.
Telephone interviews were generally conducted Monday through Thursday
from 4 p.m. until 9 p.m., and on Saturdays and Sundays from 2 -
8 p.m.. All interviews were conducted in English.
The response rate for this telephone survey is 67.66%,
calculated as completed interviews as a proportion of eligible respondents.
Calculated conservatively, the margin of error for a random sample
of this size is plus or minus 4.45 percent. The margin of error
will be larger when sub-groups of the sample are analyzed.
« Previous
« back to Research
|